How FMG Portal Drove the Best Revenue Month in Four Years on 28% Less Spend

Industry
Services
Year
Setting the Scene: The Challenge
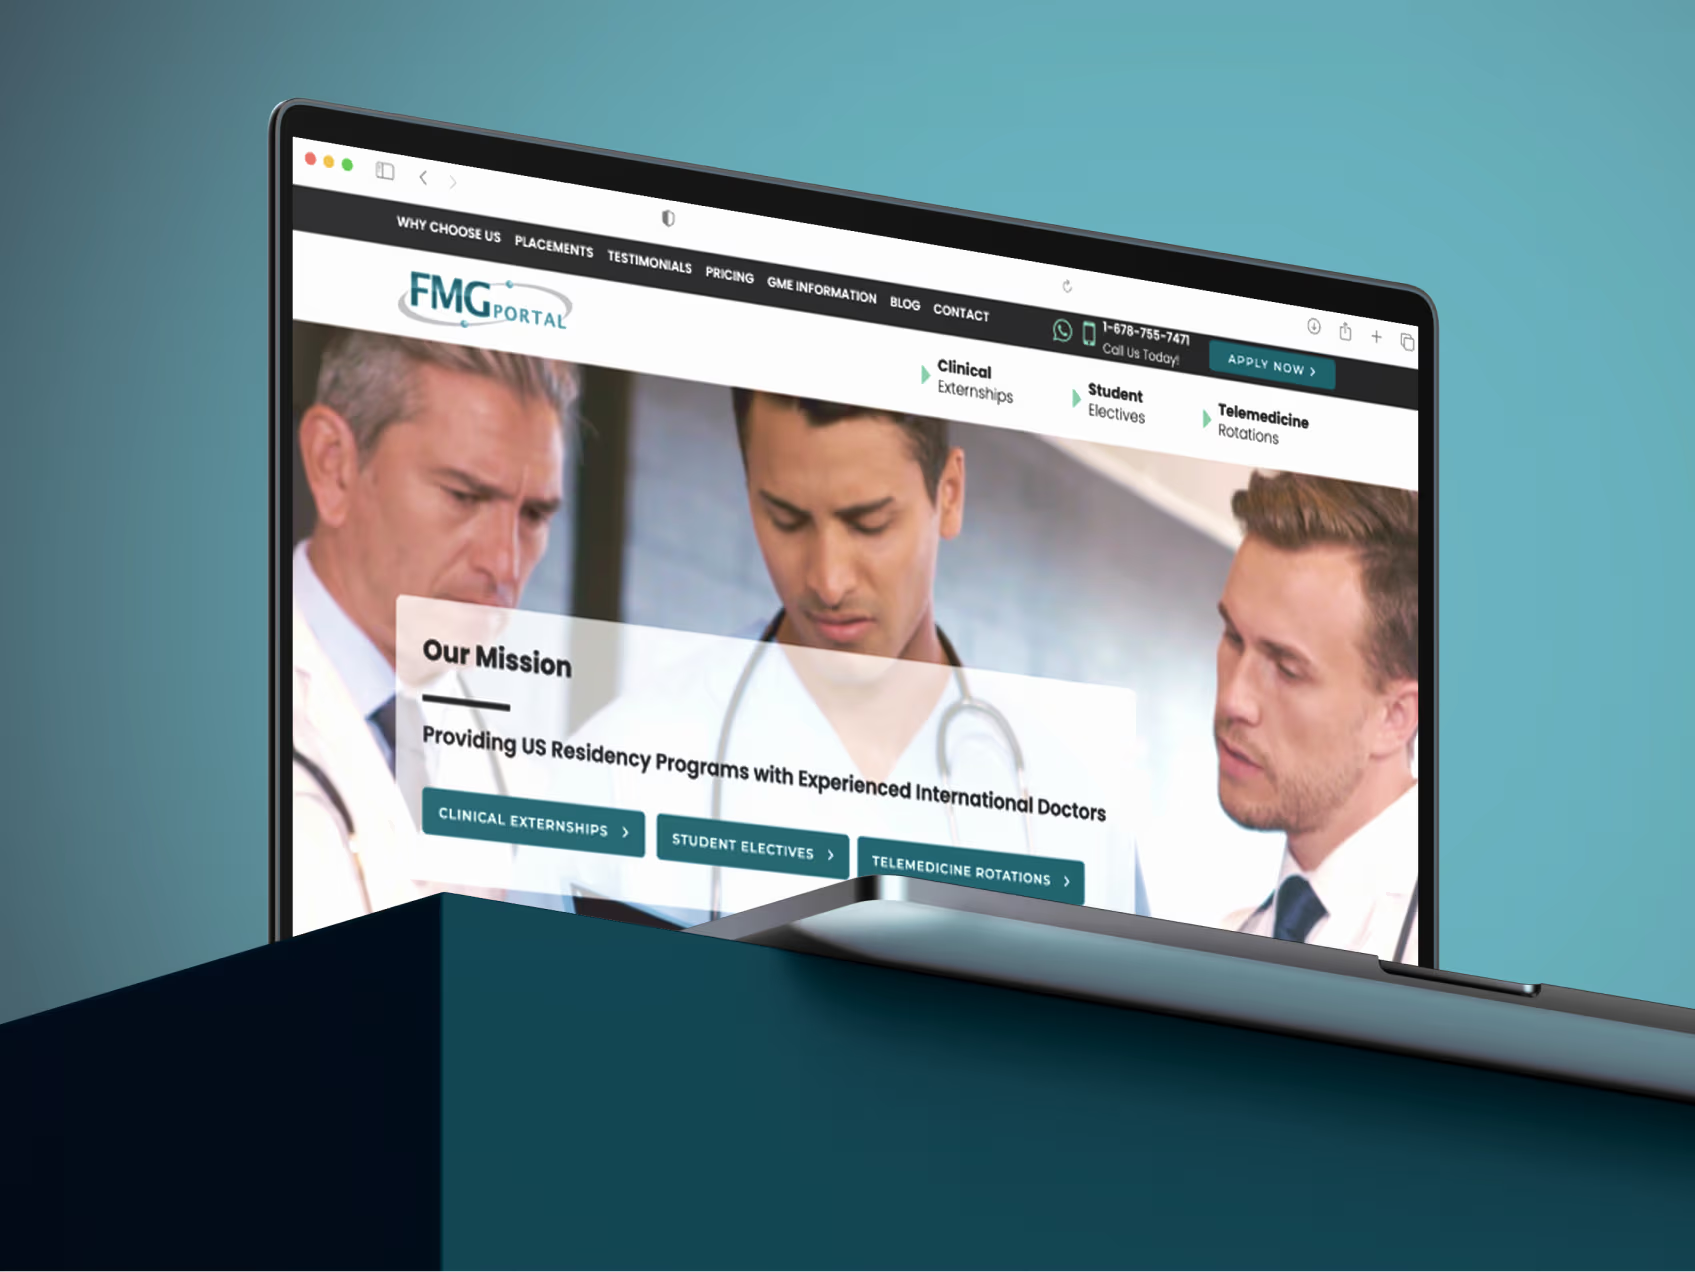
FMG Portal helps international medical graduates secure hands-on clinical rotations with US physicians. With more than two decades in the field and over 7,500 rotations scheduled, its performance has always come down to one measure: students who complete rotations.
On paper, the account looked healthy. It was generating strong conversion volume, and in-platform reporting suggested it was beating its targets year on year. The business results told a different story. That volume was not turning into bookings, and after a run of unprofitable years, performance had to change.
Three problems sat underneath the numbers:
- High-traffic regions were absorbing the budget without producing profitable bookings.
- Chasing in-platform conversion metrics was masking a quality problem, so reported performance looked healthy while the business was losing profits.
- A heavy reliance on the March-to-August peak left the rest of the year exposed.
Why It Happened: Volume From Markets That Could Not Convert
A closer look showed the account was optimized for volume at a time when the business needed bookings. Most of what was driving the gap between the two sat outside the campaigns themselves.
- The market shifted. FMG Portal's students travel from around the world to train in the US. As immigration conditions tightened, many international candidates could no longer get into the country. So, however strong their interest, they could not secure a rotation.
- Budget followed volume, not closed-won revenue. Low-cost, high-traffic regions attracted the majority of the spend. Although the initial interest seemed to be there, these areas rarely produced a booking. That left the US, the market most likely to result in a completed rotation, underfunded.
- Vanity metrics were hiding a bigger problem. Optimizing to conversions and cost-per-lead rewarded “cheap” volume. Resulting in a gradual decline of bookings that actually generated revenue.
- Competition increased. Rivals competing harder on price added further pressure at the wrong time.
The Solution: Rebuilding Around Real Bookings
Rather than adjusting the ads, T.A. Monroe rebuilt the strategy around where bookings were being secured, and where they were not. That meant making some commercially difficult decisions: reducing spend in markets that generated conversions but no revenue, and concentrating the budget where unit economics supported growth.
The approach rested on four strategic shifts:
- Booking visibility over platform signals. Decisions driven by FMG Portal’s real outcomes, not in-platform metrics.
- Structure built around geography. Rebuild the account to follow where conversions happened, with the US at the centre.
- High-intent, high-relevance search. Spend focused on the searches most likely to lead to a booking.
- Performance-led budgeting. Redirect budget continuously to what actually delivered.
The Execution: How the Account Was Rebuilt
1. Revenue Data Led the Decisions
A regular collaboration cadence brought FMG Portal's confirmed bookings into the optimization process. Rather than relying on in-platform signals alone, campaign decisions were informed by actual business outcomes. This created a direct line between ad spend and conversions. Both teams worked from a shared, accurate picture of where qualified bookings came from and what each one cost.
2. Spend Was Concentrated on the US
The campaign structure was rebuilt to mirror MQL geography rather than search demand. This gave the bidding algorithms cleaner signals to work with and enabled precise budget control by market. The US, the market most likely to result in a completed rotation, was separated and prioritized. High-volume regions that produced few bookings were scaled back.
3. Wasted Spend Was Cut
Spend was shifted toward high-intent, product-specific keywords that improved relevance and lead quality. Extensive search term analysis removed non-converting traffic, so budget was allocated to the high-value opportunities.
4. Budget Followed Performance
Lead quality and revenue data were monitored continuously. Budget was reallocated toward the markets and campaigns delivering the best results. In doing so, we ensured we didn’t lose the momentum needed for performance to stay stable.
The Results: Outcomes That Matter
The shift delivered where it counted, in bookings and profitability:
- Bookings up, spend down. FMG Portal grew bookings by 9% year on year while spending 28% less, returning the business to profit.
- Best month in nearly four years. June 2025 was the strongest month the business had recorded since August 2021.
- A steadier year. Bookings in the quieter, off-peak months grew by 20%, reducing the long reliance on the March-to-August peak.
- Momentum into 2026. The stronger performance carried into the new year.
+9%
More bookings, YoY
-28%
Less ad spend
Best
Month since August 2021
+20%
More off-peak bookings
The Bottom Line
Three decisions made the difference:
- Measure confirmed bookings, not clicks. Optimizing to real business outcomes rather than in-platform volume is what turned performance around.
- Put budget where the outcomes are. Concentrating spend on the markets that actually produced bookings did more than any change to the ads.
- Use the client's own data. Real MQL data, shared openly, made every decision sharper.
By focusing spend on bookings, FMG Portal grew results while spending less, and rebuilt a more profitable, more predictable pipeline.
Conclusion: A More Profitable, Predictable Pipeline
FMG Portal's turnaround was not really about better advertising. It was about changing what the account measured, and acting on it. Once success meant students placed onto rotations rather than in-platform volume. Resulting in budget following the students and markets that actually moved the business forward.
The impact was clear: bookings grew 9% while spend fell 28%, the business returned to profit, and June 2025 was its strongest month since August 2021. The quieter months began to hold their own too, giving FMG Portal a steadier pipeline across the whole year. For a business measured on secured rotations, those are the numbers that count.